The two major world contradictions facing workers and toilers
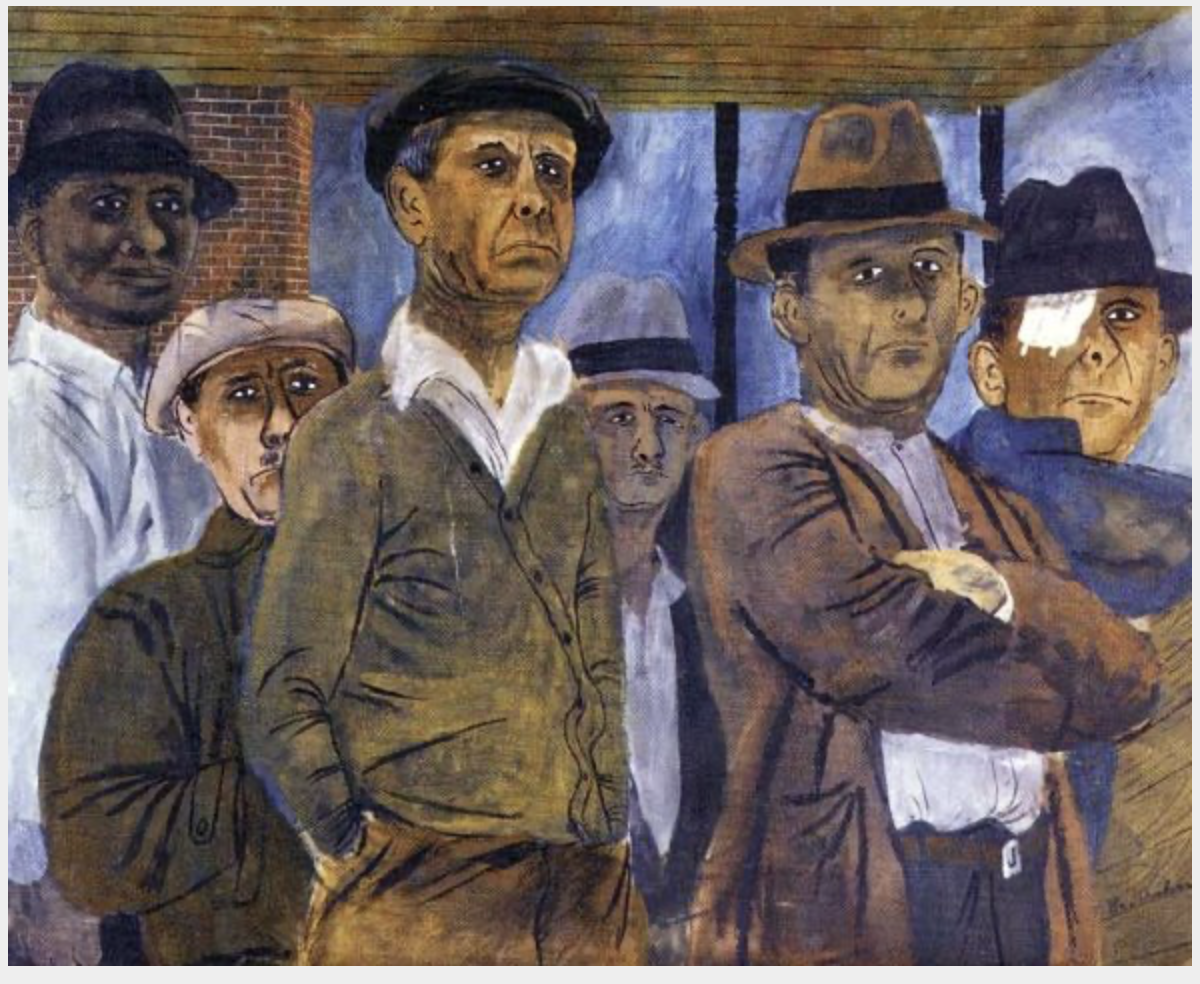
Image: Ben Shahn (1898-1969)”Unemployment,” ca 1934; From ‘My Daily Art Display blog by Jonathan5485
Brief notes on image and artist: Ben Shahn was born in Kovno, Lithuania in 1898, in the Jewish Pale of the Tsarist Russian Empire. His father was exiled to Siberia for his socialist politics. His parents escaped and brought the family to the USA. Ben went to City College of New York to study art, but after experiments, he adopted a Realist style. He worked with photographer Walker Evans (1903-1975) and the Mexican muralist Diego Rivera (1886-1957) and various French Realist painters.
For Marxists, perhaps Shahn’s best work came as he developed, along with others in the New Deal era, the themes of “class dissent, unemployment, urban suffering and depression” (Heather Becker). By 1946, his posters, including “All these rights we have just begun to fight: Register/Vote” – for the CIO-PAC and the American Labor Party, garnered the praise of Daily Worker art critic Marion Summer (nd)- as “one of the few who has successfully used the visual language of modern art to express social meaning “. (Andrew Hemingway).
As far as we know, he never joined the Communist Party, and later he became a ‘symbolist’. His objective reality drifted away from communism. He was even funded by the MoMA (Museum of Modern Art New York) and the CIA in 1956, to present at the London Institute of Contemporary Arts (Laura Katzman). But nevertheless – he was always seemingly on the people’s side.
He apparently always retained a view of art as being relatable and of relevance to real life. In his public argument with Robert Motherwell (1915-1991), the leading abstract painter whose art he had termed “having no content… decorative and good to taste, like a wedding cake“; (Martín and Katzman). Indeed, after being appointed to the Norton Professorship of Art at Harvard University, he told his students in a lecture to: “Get a job in the potato field; or work as a grease monkey in an auto repair shop… do not fail to observe the look and feel of earth.. yes even potatoes! Or in the auto shop, the smell of oil and grease and burning rubber.” (Fagg).
MLRG.online 30 September 2026.
Sources Wikipedia; and :
Heather Becker “Art for the People”; San Fransisco 2002; p.96-97;
Andrew Hemingway; “Artists on the Left”; New Haven Yale 2002; p.211;
Laura Katzman (p.26); & Beatriz Cordero Martín and Laura Katzman p.53; & John Fagg p.41 – All in Laura Katzman Ed; “Ben Shahn – On Nonconformity”; Princeton 2025;
Introduction
This issue highlights some of the most recent data that concerns two major contradictions in the world today. They are examined from the viewpoint of the working class. Where possible, we will use graphic data drawn from a variety of sources, and a short summary of its meaning.
The two main contradictions are:
Firstly, the contradiction between the ruling class and the ruled classes. Of course, this contradiction between the ruling class and the working class and toilers of each country is the main and primary contradiction in the world. This requires little need for discussion here. What we will do, however, is show up-to-date information on rising inequity.
Secondly is the contradiction between USA capitalism and Chinese capitalism, the struggle between the two dominant imperialisms. This is superimposed on top of the primary contradiction. However, it also serves as a further stimulus to other inter-imperialist contradictions. We argued recently that:
“… the ruling class of the USA is united on their need to secure their profit base. In this, it is necessary that it prepare for a coming battle with its major international opponent – the Chinese state. The European Union (EU) is another opponent – but one of less urgency than that of China. … the goals of the ruling class of the USA now are to re-structure its state to ensure its hegemony against its main rivals, the People’s Republic of China (PRC) and the European Union…
(To prepare for this coming battle)…
The USA ruling class is attempting to carry through major changes…. aimed at no less than the complete submission of the working class and the working class or petit-bourgeois managers of the state… the ruling class aims to erase a whole era of reforms in the USA post-war..”
Theses on The Trump 2 Administration and the USA Ruling Class: A re-set to a new imperialist order”; MLRG.online 13th April, 2025
Here we will focus more on developments inside China.
Definitions and methods
We do not here rehearse whether China is socialist or not today. We have adequately explained previously the basis for our view that the People’s Republic of China never expropriated the Chinese national bourgeoisie (“Announcement of Publication: Selected Works of W.B. Bland, Volume 1 The China report”; at MLRG.online January 2025; “Observations of a French Statesman on State-Private Enterprises in 1950s China”; April 13, 2025). We recognise that this argument is not accepted by some, including the Marxist economist Michael Roberts. We will deal with this objection separately, however.
We also will not here parse definitions of what the working class is. In other articles we discuss this, including in “Classes in Modern Britain” – an examination of the labour aristocracy of Britain in 1966 “; (see MLRG.online 30 August 2026). Much of the data we cite is from liberal academics, who largely eschew the terminology of working class etc. We will note that they use largely designations by percent of earning capacity, or percent of wealth. We will use the simple working assumptions:
i) That the lower 50th percentile of either wealth or income – consists of the working class.
ii) That the top 10th percentile of either wealth or income – consists of the ruling class.
iii) That the middle 51-11th percentile of either wealth or income – consists of mainly working class also – although this assumption is open to considerable qualification.
The general argument rests on data of the top 10% and the bottom 50%. Hence the equivocation on the middle 40% is not critical, at least in our view. That 40% are likely to be largely working class, with some petty bourgeoisie. We admittedly do not dissect out those who are in that 40%. Instead we infer those terms are closely related to the objective sense of the ownership of the means of production and the daily need to sell labour power.
For MLRG.online 28 September 2026.
The first contradiction: between the ruling class and the ruled classes
We believe seven essential points help to show this stark and growing contradiction.
(i) The world is unequal in the distribution of income and wealth. Figure 1.
It is obvious that the world is growing in the degree of inequity between classes of people. We will shortly focus on incomes and wealth in the most developed imperialist nations. But it is important to recognise that this is a universal world-wide phenomenon.
Hence, the first graph shows 2026 data for all the world’s income (on the left-hand side) and wealth (on the right-hand side. The authors themselves title this graph as “The world is extremely unequal”. The y-axis is the share of global income or wealth as a percent.
The blue bars show the share of income or wealth belonging to the poorest section of the world (the bottom half – 50%) of the world population. Compare this population’s wealth and income to that of those in the red bars. This represents the top 10% of the world population. Again, without nit-picking, we label these two extremes as unequivocally the working class as blue and the ruling class in red. For now, we will ignore the green bars which represent the middle 40% of the population.
Pared down to its most simple message – those in the ruling class obtain 53% of the incomes, and have 75% of the total wealth. In stark contrast, the poorest 50% of the population have an income share of 8%, and own 2% of the total wealth.
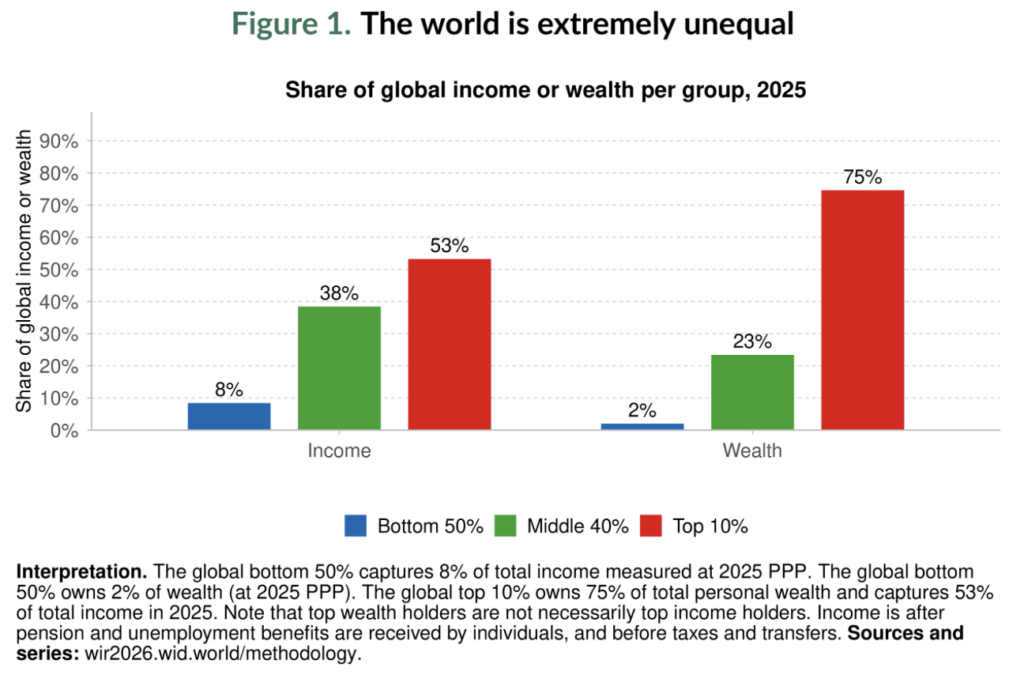 Edited by Lucas Chancel, Ricardo Gómez-Carrera, Rowaida Moshrif, and Thomas Piketty; “Executive World Summary; World Inequity Report 2026; at WIR 2026
Having first displayed the data world-wide, here we look more closely at the richest and most powerful countries. The same pattern can be generalised to all countries in the world. However, specific country data is not within our means currently, and is the task of Marxist-Leninists in all these countries.
We shift now to another way of expressing this inequity using is the “Gini Coefficient”. The Gini coefficient is a common measure of income inequality. It summarizes the distribution of wealth and expresses it in terms of a number from 0 to 1. Higher values indicate higher inequality, where zero ‘0’ would be a state of perfect equality. The Gini coefficient is on the y-axis, and the x-axis shows the years from 1963 to 2024.
It shows a tendency to increase from the 1980s onwards. But because the y-axis is on quite a wide scale (Here from 0.0 to 0.5) this does not fully emerge.
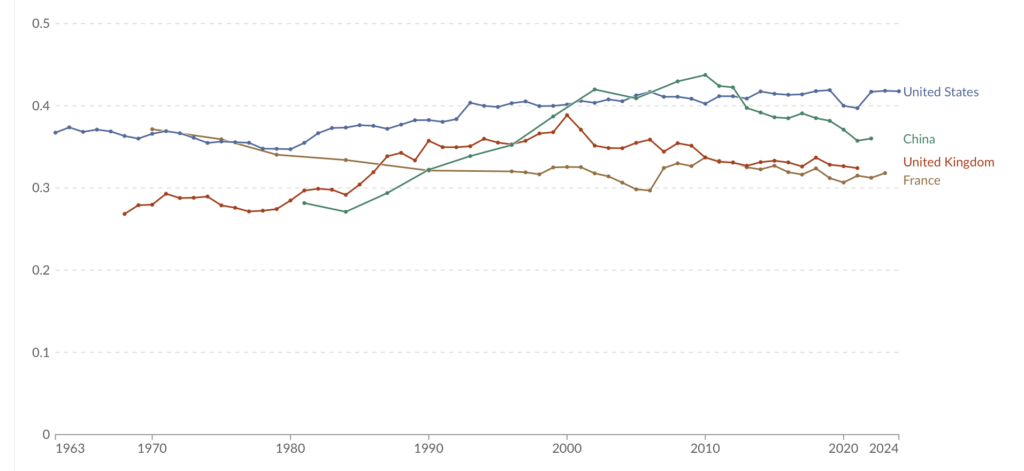
Data compiled by interactive graphics at Our World in data website, accessed 1 October 2026
But a larger scale on the y-axis more clearly shows the dramatic shift up in inequity. This now only focuses on the USA.
In the graph below, the y-axis is plotted on a total scale of 0 to 100. But this can be compared with the other figure by simply putting a “zero-point 0”, and then expresses the Gini on a scale of 0 to 1. But this graph only shows the y-axis from 0.34 to 0.42. Thus the FRED data below – of a GINI at the end of the time-period – the year 2024 – reads either 0.415 or 41.5.
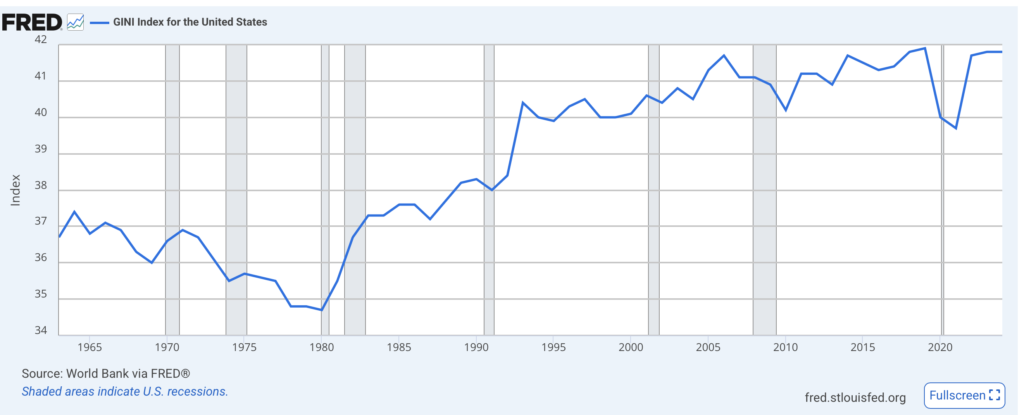
Data from USA Federal Reserve Economic Data (FRED) at Accessed 1 October 2026
Admittedly however, the concept of the Gini coefficient is pretty abstract. Therefore, the following graphs interpret this growing inequality in slightly differing, and perhaps more tangible ways.
(ii) Those figures of wealth and income inequity are a failure of “incomes” to keep pace with increases in societal “wealth”
Data for the most aggressive imperialist nations of the West (the UK, USA, France and Germany) are compiled below. They show that wealth accumulation has progressed over the years 2000-2020.
This is expressed as “median disposable net worth” being the “net worth of property, business and financial worth‘. For each country, the y-axis shows the medians of wealth ownership (in dark blue). But wages are also shown (in light blue).
In the graph, the baseline of the y-axis starts at a ‘standardised number of 100’, which is simply the value of wealth and wages in 1995. Wealth accumulation rose dramatically between 1995 to 2020, but the wage levels rose only slightly. The level of wealth approximately doubled while that of income rose approximately by a third.
The corollary, of course, is that the wealth went to the ruling class.
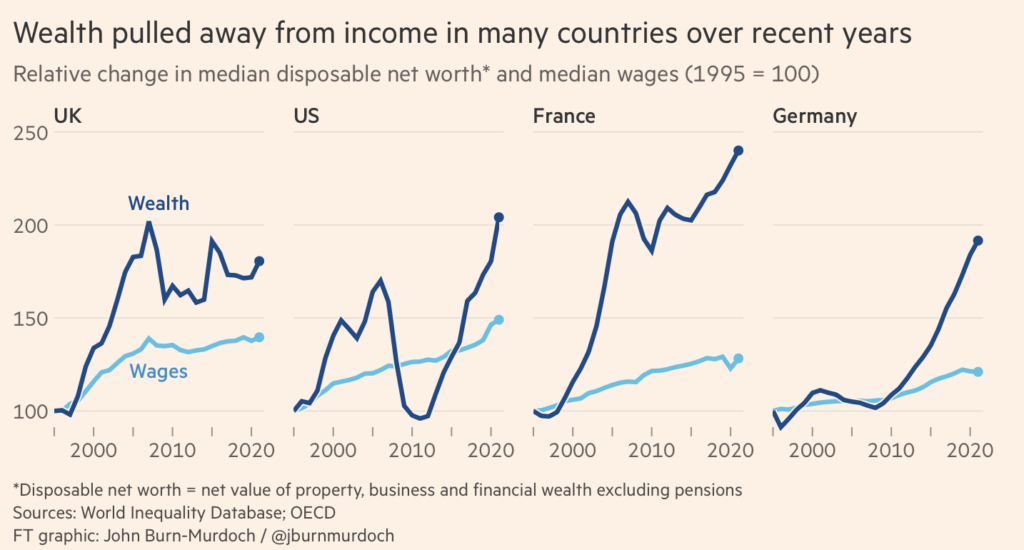 John Burn-Murdoch; “We’ve moved from income world to wealth world”; Financial Times July 31 2026
(iii) This phenomenon of wealth overtaking any income is especially marked in the very rich
Even more dramatic changes are shown if the very top earners of income (here we talk only of the top 0.1% earners (dark blue – the top line), are compared to the bottom 90% earners (in light blue – the bottom line).
The y-axis here shows the percent change accumulating over the years 1980 to 2020 (x-axis).
The top earners rise in wages over this period amounted to 182% since 1979. Wages of the bottom 90% grew only, when to keep pace with the rise in top earnings it should have been 65%. Thus, the wealthier ruling class continues to get wealthier over this period of time.
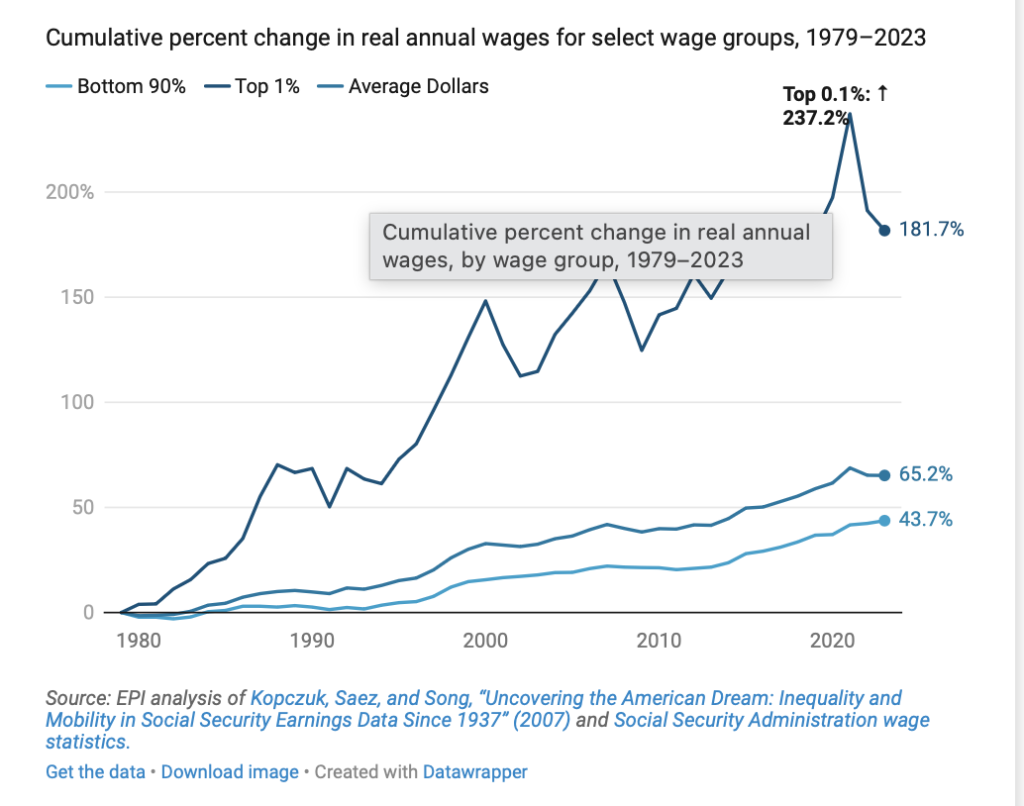 Elise Gould and Hilary Wething; Graph 4; “Wage suppression in 10 charts” ; Economic Policy Institute; September 23, 2026
In fact the proportion of the entire production of society goes less and less to those who produce that productivity and welath. This is shown explicitly next.
(iv) Across society in the USA there has been a falling share of the total production of the society’s production (measured as gross Domestic Product) – that accrues to the labourers.
Overall, the share of the Gross Domestic Product that goes to the working class as salaries has been steadily falling since 1955. Of itself that graphic is difficult to interpret. But the next point crystallises the issue.
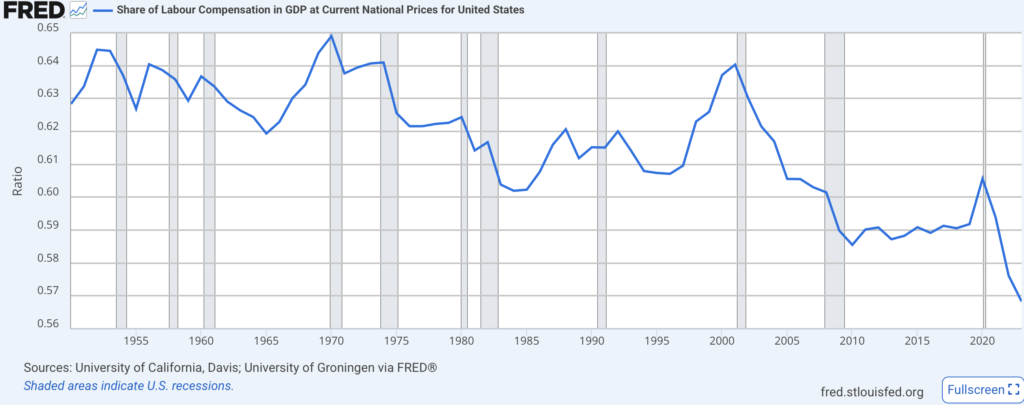
Data from Federal Reserve Economic Data (FRED) at: FRED here
To drive this point home, what is the comparison of the proportion of productivity in wages as compared to the overall productivity? Especially since over this time generally, the yearly growth of overall productivity has been steadily growing in the USA for certain. This is shown below.
(v) Labour share of growth is falling while the “productivity” or GDP is growing.
This compares the hourly rates of societal productivity to the wage compensation. In the graph below, both are shown where the period of 1948-1979 is contrasted to the period of 1979-2025. While productivity has increased steadily, it outstrips the much slower rise of compensation.
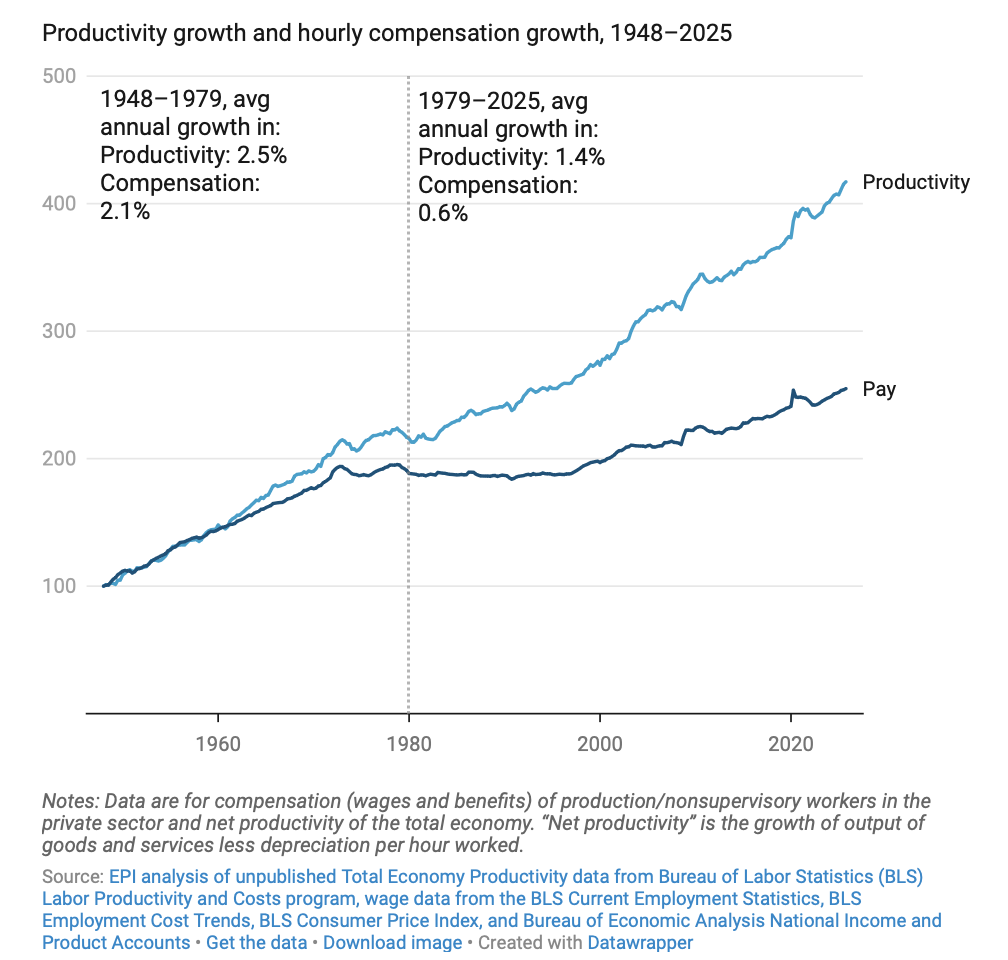
Elise Gould and Hilary Wething; Graph 2 ;”Wage suppression in 10 charts” ; Economic Policy Institute; September 23, 2026
(vi) The levels of monopolisation by the leading companies owned by the top 0.1% is extraordinary.
Finally, that top layer of society we noted earlier – the top 0.1% or even the top 10% – is not of course only individuals. It is composed of the magnates, the owners of the big firms or companies or banks or industries. The current battle in industrial development focuses on robotisation and artificial intelligence (AI). Both China and the USA governments have pitched enormous capital into developing this. Monopolisation has taken place in a huge manner.
To see this vividly, consider the two graphs below.
The raw data for the first one comes from the “MSCI ACWI (All Country World Index)”; run by MSCI Inc. This is an “Exchange Traded Fund”; which helps investors keep track of global stock performance. As one website (Brazen Capital) puts it: ” it is like a snapshot of the world’s biggest and mid-sized companies across developed and emerging markets” (Brazen Capital accessed 6 October, 2026). Its data was used to compile the graph below by “The Daily Shot Brief” showing that the weighting for the USA high-tech chips firm NVIDIA – is greater than that of Japan. As The Daily Shot states: “NVIDIA’s weighting … in the MSCI All Country World Index – has now surpassed that of Japan. In other words, if NVIDIA were considered a country, it would rank as the second-largest in ACWI, behind only the United States.” The Daily Shot Brief October 6, 2026.
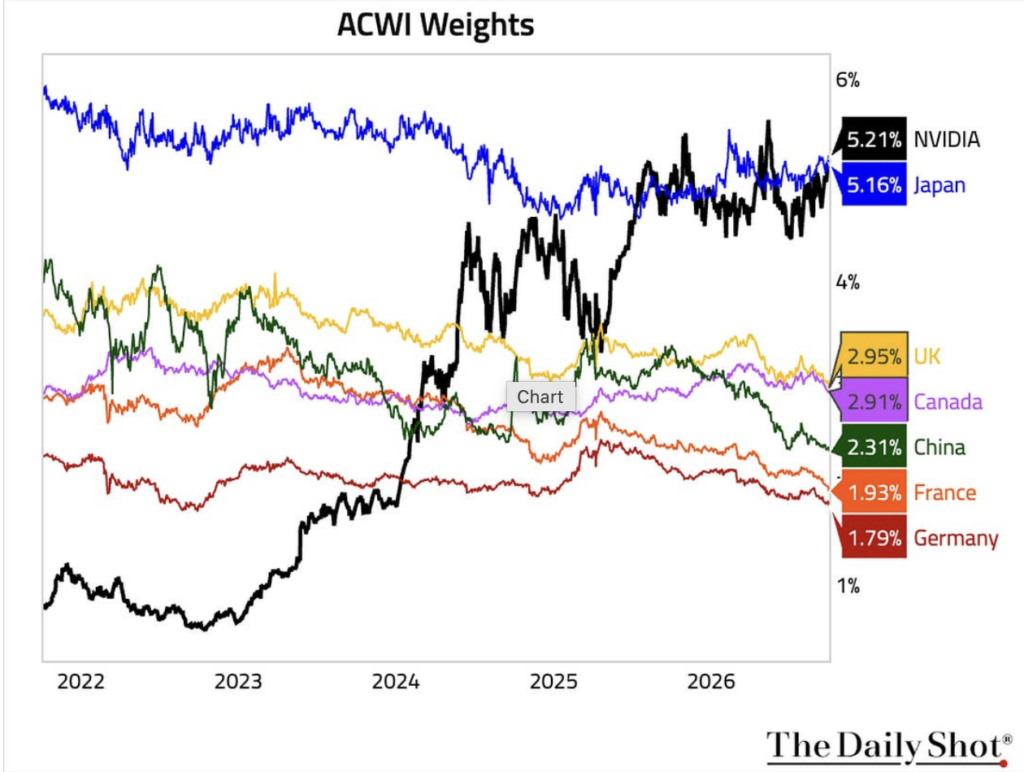
This speaks to the potency of current-day monopolisation. In the matter of artificial intelligence, we see the extraordinary role of levels of monopolisation at a massive level. One far greater than that written about by Lenin in his “imperialism”.
This monopolisation is seen quite blatantly when cross-linkages are examined between the various AI leading companies, at least those in the USA – for which concrete data is available. Below is an inter-connectivity map of the main Western developers and profiteers of Artificial Intelligence. There is no reason to think it is different in China. If we restrict ourselves only to thinking of the implications for the USA – all the below firms are USA. Three of them are NVIDIA firms – and we saw above that its’ leverage is greater than that of Japan.
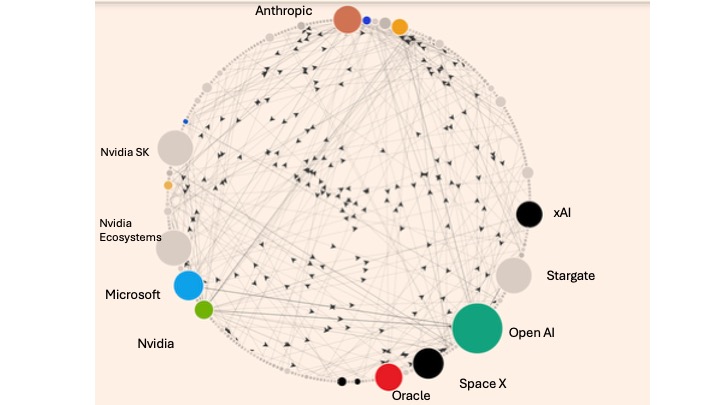 Toby Nangle; “Joining the dots between big AI In the loop?”; Financial Times September 18, 2026
This non-animated version (of Toby Nangle’s original animated version in the Financial Times, see reference above) – only shows a bewildering number of interconnections. To display the depth of the meaning in this non-animated version requires considering it together with this table below. This simply tabulates statically the vast amounts of monies the size of the bubbles represents. Starting at the top light brown-umber circle – Anthropic – and moving counter clockwise we cover below only the biggest circles – that is the main shark-firms:
Firm Commitments made Commitments received
(in billions of USD) (in billions of USD)
Anthropic 219 86.5
NVIDIA SK Undisclosed 500.0
NVIDIA Ecosystem Undisclosed 500.0
Microsoft 68.266 280 light blue blob
NVIDIA 142.08 0.16 light green blob
Space X compute
infrastructure Undisclosed 31.66 Not marked; next black blob
Oracle Undisclosed 300.0 red blob
Space X 310 65.0
Open AI 696.85 275.3
Stargate Undisclosed 500
xAI Undisclosed 278
Amazon 8.0 100.0
(vii) At the same time the working class representation in “Western” parliamentary democracies has fallen
We close this discussion of the First Contradiction, by considering merely one factor of power. That is – “Who exerts overt power in the Western countries by virtue of physically being in their parliaments?” Of course this is a simplification of who exerts power. But it it nonetheless useful to see.
It is not coincidental that over this time, the ability to exercise real power of the working class has fallen. While power is exercised outside of parliaments, even the proportion of working-class representation in parliaments has fallen from 1900 to 2025. In the three countries France (blue line), USA (red line) and the UK (orange line) the working class’s representation has fallen. The graph below shows the “share of MPs whose last occupation before entering politics was a manual or blue-collar job, compared to the total number of MPs in each country“.
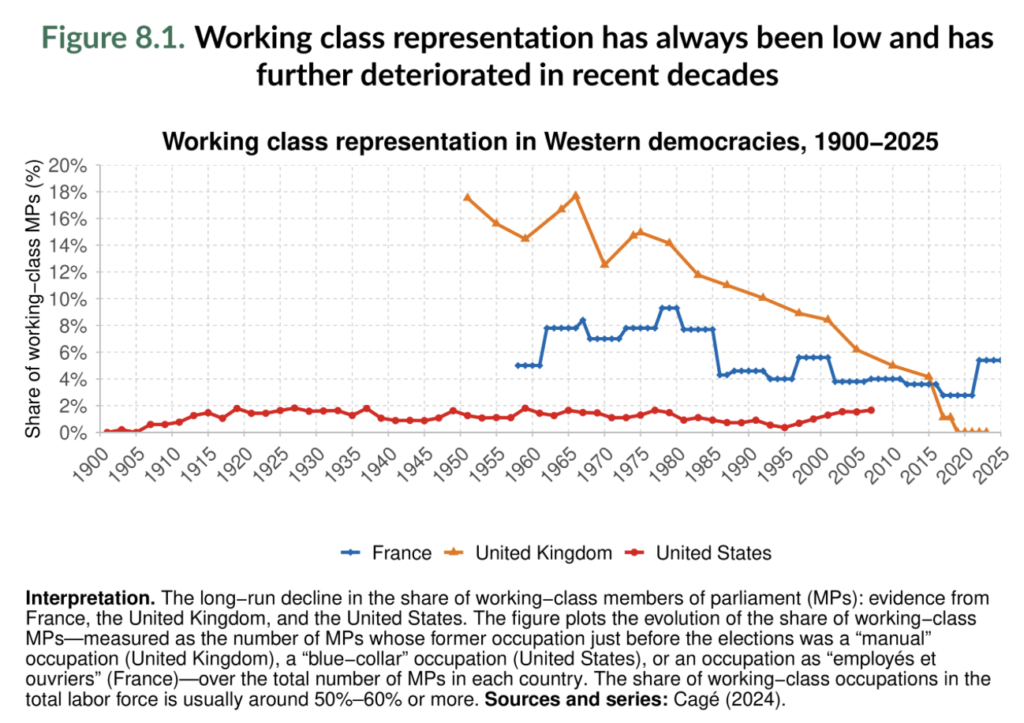 Edited by Lucas Chancel, Ricardo Gómez-Carrera, Rowaida Moshrif, and Thomas Piketty; “World Inequity Report 2026; Chapter 8; at WIR 2026
Interim Summary
Collectively, these graphs confirm what workers – and their many and varying Marxist theoreticians have argued for years. Let us move to the second major world contradiction today.
2. The contradiction between the two leading imperialists – the USA and China
We will not here consider in any depth at all the European Union (EU). As noted we previously stated:
“… the ruling class of the USA… (faces) – its major international opponent – the Chinese state. The European Union (EU) is another opponent – but one of less urgency than that of China…”
Theses on The Trump 2 Administration and the USA Ruling Class: A re-set to a new imperialist order”; MLRG.online 13th April, 2025
We have written previously about the trade conflict between the USA and China, including at “The USA 2024 Presidential Elections – Should socialists advocate election boycott?” October 2024; MLRG.online
In regards to this second contradiction – we want to convey only two main points.
First, that China has become more than just a simple export economy;
Second, China has become the most formidable competitor that the USA faces.
We approach this first from the aspect of overall GDP and trade of the two countries.
Then we will consider the problems that both the USA and Chinese economy face currently. We already saw above that China has a great deal of inequity (See Gini graphs above).
We willingly concede that there is a long-standing debate currently on the meaning of the concept of GDP for Marxists. We have stated previously that:
“The so-called Degrowth school (also termed zero or negative growth)… argues that a reduction of consumption of the population, thereby reducing use of the natural resources of the world, is needed. … Greta Thunberg’s solutions fit into this broad category. … this is remarkably close to the ‘Club of Rome’ analysis…
Elements are adopted by several in the overtly Marxist camp, including John Bellamy Foster, Fred Magdoff, David Harvey. More completely convinced, Andre Gorz, and recently Mark Burton, Peter Somerville advise such a path. …
It seems fair to us, to label these as utopian solutions. But perhaps a… description is that these are neo-Malthusianism…”
Situating Today’s Climate Activists of the ‘Fridays for Future’ Movement
Hari Kumar 7 October, 2019; at Marxist-Leninist Currents at American party of Labor site.
Returning to the main argument:
The problems of unemployment and of the rise of profit over people’s well-being are not different in China from any other capitalist nation.
i) China is now the second leading country in terms of Gross Domestic Product (GDP).
A short terminology on GDP:
To account for different sizes of the population, it is common to use the adjusted value of GDP expressed as GDP per capita.
But another problem arises in comparison of differing countries. That is the different cost-of-living prices:
“Gross Domestic Product (GDP) is the total market value of all final goods and services produced within a country’s borders during a specific time period. Usually, this is measured in a single currency, such as the US dollar. However, using simple market exchange rates to compare GDP can be misleading because the cost of living varies wildly between countries. For example, $5 USD might buy a full meal in one country but only a cup of coffee in another.”
AI generated by “Gemma 4” via Google, 29 September 2026.
To address this, it is common to use the adjustment of Gross Domestic Product based on Purchasing Power Parity (GDP PPP). What is this PPP?
“Purchasing Power Parity (PPP) … adjusts for these price differences. Instead of using the current market exchange rate, PPP calculates how much of a “basket of goods” (a representative sample of common items like food, housing, and clothing) a local currency can actually buy within its own country compared to what that same basket costs in another country, usually the United States.
When you combine them into GDP PPP, you get a measure of a country’s economic output that reflects the actual living standards and purchasing power of its citizens.”
AI generated by “Gemma 4” via Google, 29 September 2026.
The effect of this is to take into account local market buying power:
“For instance, a country might have a relatively low GDP when measured by market exchange rates because its currency is weak on the global market. However, if local goods and services are very cheap, that same amount of money allows the population to buy much more. Consequently, the GDP PPP for that country will often be higher than its nominal GDP, providing a more accurate picture of the actual volume of goods and services produced and consumed.”
AI generated by “Gemma 4” via Google 29 September 2026.
Looking simply at GDP – as below – the raw figure shows the USA (blue line) is rather larger than the GDP of China – and both have grown over the period 1960-2025:
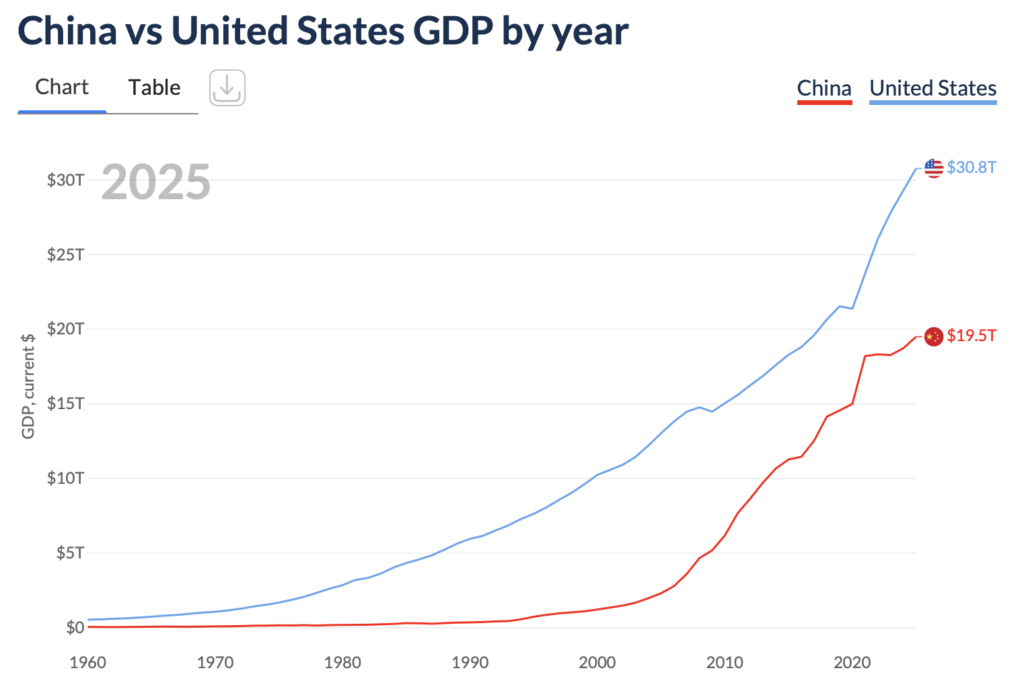
At georank accessed 29 September 2026
When the figures are adjusted – both as per capita alone; or as per capita and PPP – the difference is starker. The USA is by far higher than China.
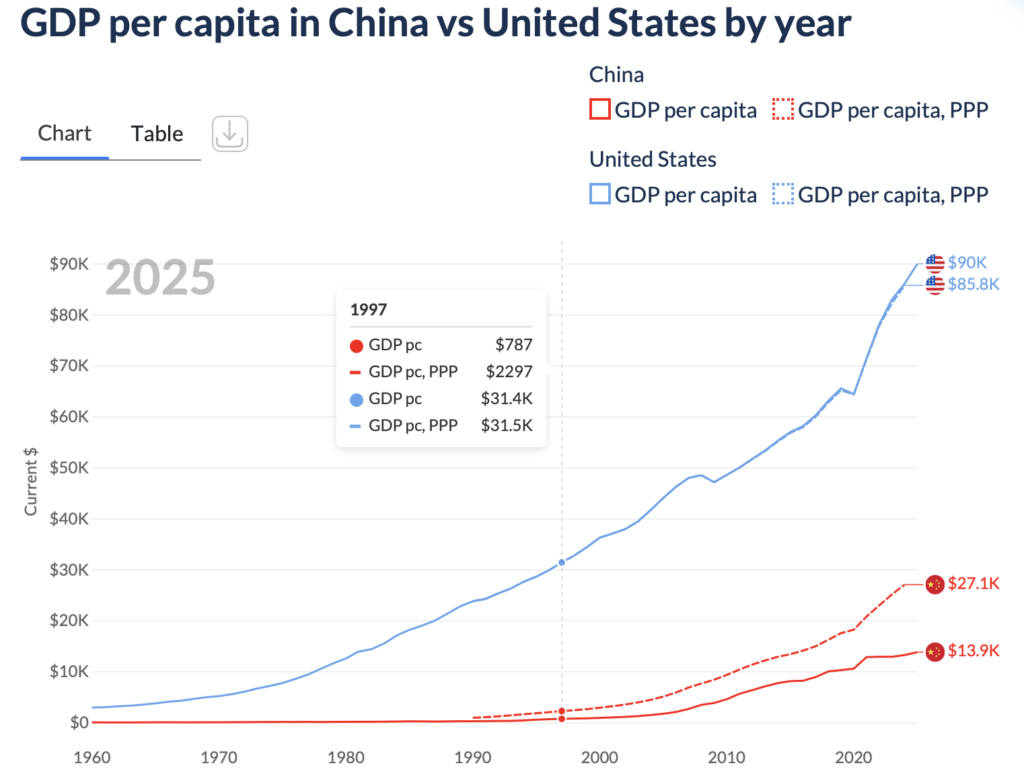
At georank accessed 29 September 2026
Thus, the USA has a major hegemony. Herein on, this piece focuses on how this is being dismantled at the present time – by China. We then end with looking at the tensions within the Chinese economy. Those tensions – are essentially the same as in the USA.
ii) China’s rivalry to the USA and also other blocks including the EU is growing.
It is true that currently China is dominant in only a few, as expressed in market share of various commodities.
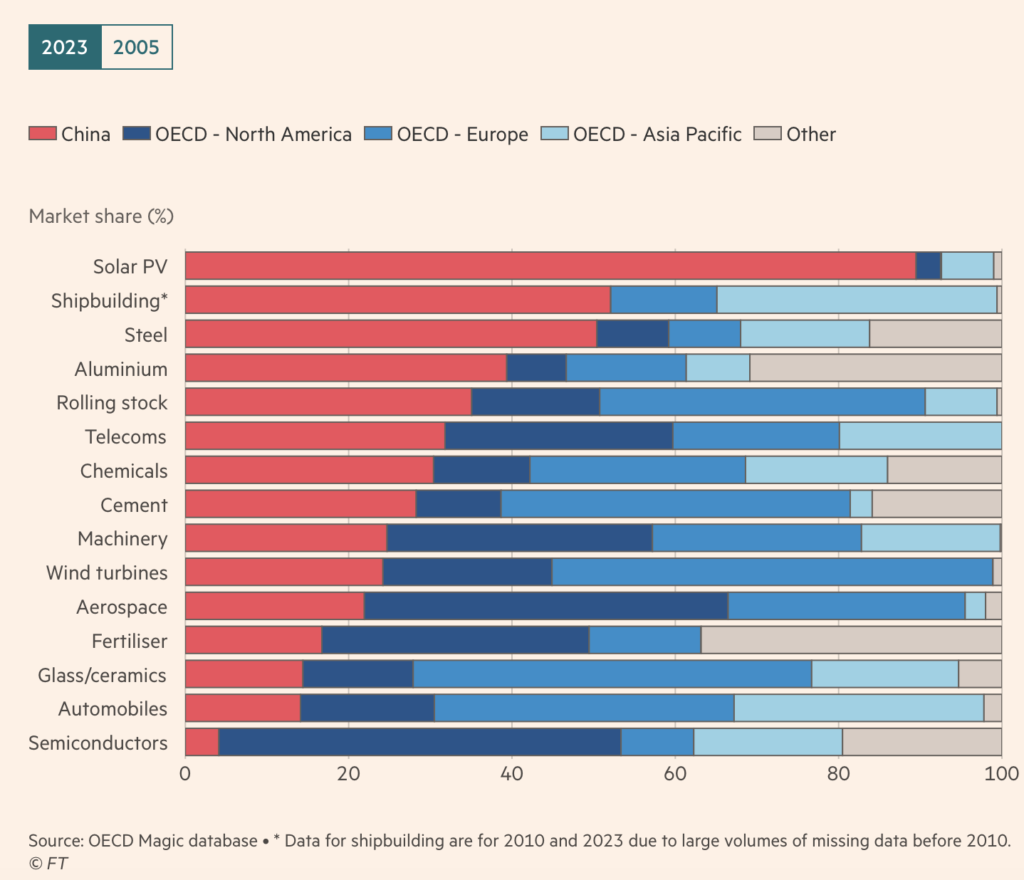 Ryan McMorrow, Sam Fleming, Peter Foster, Joe Leahy; “China shock 2.0: the flood of high-tech goods that will change the world”; Financial Times April 14, 2026
(iii) The internal Chinese inter-capitalist rivalry and competition is very fierce – which drives its international competitiveness
If a Chinese firm can succeed inside China, it is a dangerous competitor outside of China also:
“Now a second shock is under way — one that is even more threatening to China’s trading partners: an assault on high-end manufacturing.
Vicious domestic competition, coupled with vast industrial scale, ample pools of engineering talent and some of the highest subsidies in the world, has generated world-beating Chinese champions in EVs, solar panels, batteries, wind turbines and a lengthening list of advanced manufacturing sectors. But the same forces that forge those companies also tend to generate overcapacity, crushing margins at home while flooding global markets and fuelling trade tensions. Aided by an undervalued exchange rate, Chinese groups are cutting a swath through the most advanced industries around the planet.”
Ryan McMorrow, Sam Fleming, Peter Foster, Joe Leahy; “China shock 2.0: the flood of high-tech goods that will change the world”; Financial Times April 14, 2026
(iii) The current Chinese economic threat to the USA and other capitalists is in high technology goods
Exports from China “shocked” the Western world in prior decades in the so-called China Shock 1. But the pattern was then, that of simple goods, of low technology, and imparting less value to the goods produced. That is value as in the Marxist sense. In this, it makes more value the more complex the labour power used, and includes both the present labour power and the prior embodied ‘dead’ labour power in the machines:
“The process of production, considered on the one hand as the unity of the labour-process and the process of creating value, is production of commodities; considered on the other hand as the unity of the labour-process and the process of producing surplus-value, it is the capitalist process of production, or capitalist production of commodities.
… in the creation of surplus-value it does not in the least matter, whether the labour appropriated by the capitalist be simple unskilled labour of average quality or more complicated skilled labour. All labour of a higher or more complicated character than average labour is expenditure of labour-power of a more costly kind, labour-power whose production has cost more time and labour, and which therefore has a higher value, than unskilled or simple labour-power. This power being higher-value, its consumption is labour of a higher class, labour that creates in equal times proportionally higher values than unskilled labour does.”
Karl Marx. Capital Volume One Part III: The Production of Absolute Surplus-Value Chapter Seven: The Labour-Process and the Process of Producing Surplus-Value; Section 2. The Production of Surplus-Value”; at Marxist Internet Archive
In essence, the more complex the work that is performed, the more value is imparted to it by labour power. Thus nowadays perhaps industrial machinery and electrical machinery are some of the most value-laden – and bear more profit to the capitalist.
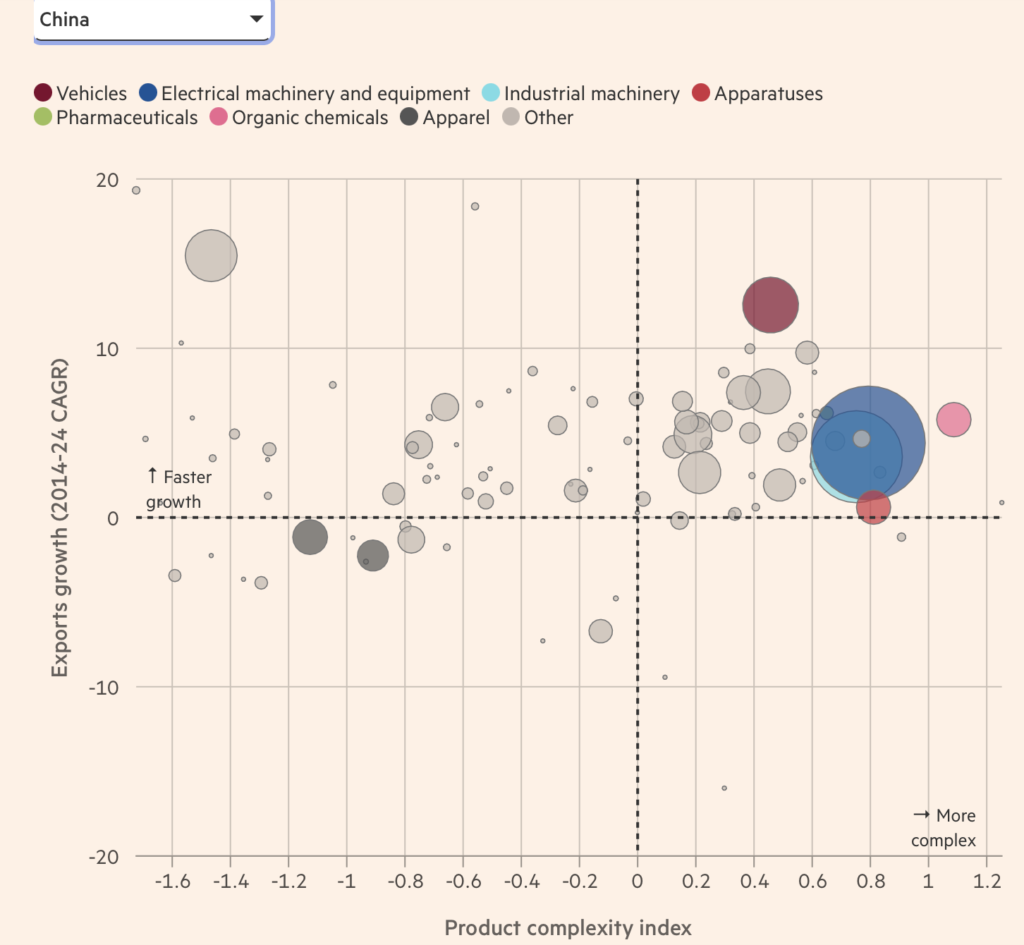
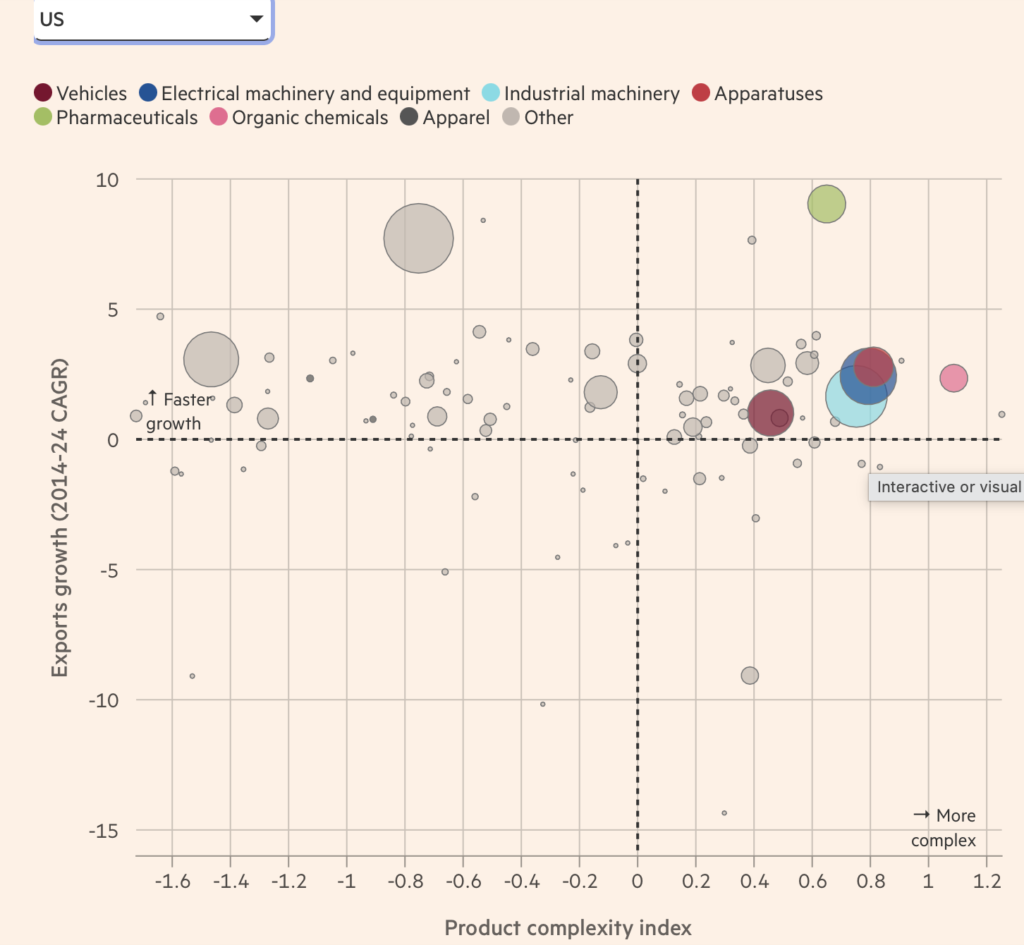
There follow two figures, the first to show the “complexity index” of China and below it the same “complexity index” but now for the USA.
Along the x-axis is depicted the increasing complexity of production needed for goods – to the right of the midpoint of zero. To the left of that mid-point zero, the produced goods require less complexity. The y-axis shows the growth of exports, going upwards from the dotted horizontal line is a total growth – while going down from that horizontal line is a contraction.
The size of the dots shows how big the industrial sector is, and the sectors are colour-coded as the caption shows.
China is growing more than the same complex spheres in the USA. Not shown is the German figure, and China’s growth in the value-laden industries is larger than that of Germany also.
Both figures are from Ryan McMorrow, Sam Fleming, Peter Foster, Joe Leahy; “China shock 2.0: the flood of high-tech goods that will change the world”; Financial Times April 14, 2026
Exposure of markets to Chinese penetration
The threat to the USA and other Western industrialised countries is also vividly seen the degree of “exposure” to Chinese penetration of their home markets is. But how can this be measured? An index of this exposure has been developed of “key indicators of influence, including trade, investment, military and diplomatic ties.”
This can be examined in a computer model for how “exposed” differing countries are to Chinese penetration. It seems that overseas markets are highly vulnerable, or “exposed” – as follows:
“The index used computer simulations to weigh key indicators of influence, including trade, investment, military and diplomatic ties, in order to build a systematic ranking of countries’ exposure to China… It found that Europe’s efforts to reduce its exposure to Chinese chokepoints had achieved only a “modest” impact since the EU designated China a strategic rival in 2019.”
Peter Foster; “UK and Germany among economies most exposed to China, new modelling shows..” Financial Times 24 September 2026
This can also be graphically depicted, as below. Countries examined are on the right-hand side – each one below the other. The Global rank of exposure is numerated from ‘most exposed” of 1 unit to 15 being “most exposed”. The light blue line is the USA – which was “most exposed” in the years on the top between 2013-2020. After that the exposure dropped but has risen again. It is currently, according to this index, the 4th most exposed to China.
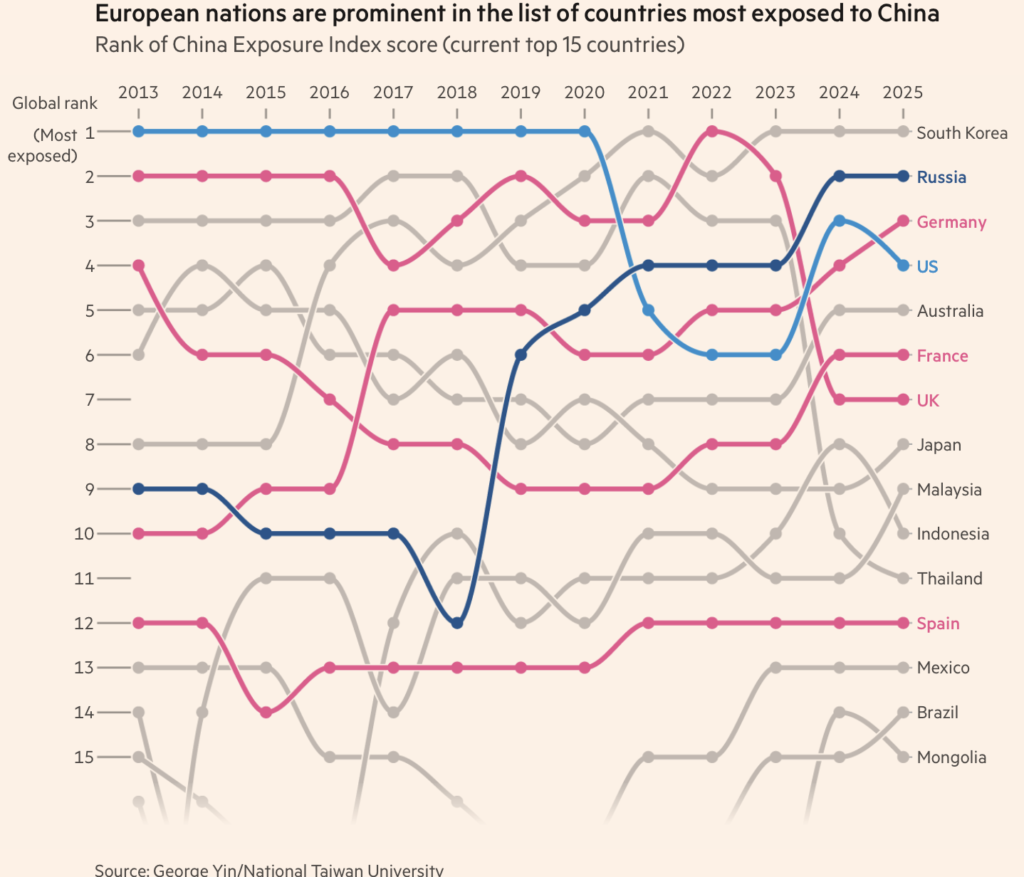
Peter Foster; “UK and Germany among economies most exposed to China, new modelling shows..” Financial Times 24 September 2026
Not only the USA but the EU is also threatened by this relationship:
“The EU is also confronting Beijing over its €1bn-a-day trade deficit with China, which European Commission president Ursula von der Leyen last week called “unsustainable”.
Peter Foster; “UK and Germany among economies most exposed to China, new modelling shows..” Financial Times 24 September 2026
(iv) The social burdens on the working class of China: unemployment, ‘flexible’ work and precarity
It is no surprise that there are the same systemic issues running through Chinese society, as there are in the older Western-based imperialisms. For example unemployment. The overall rate of unemployment in the cities – officially – seems to have been relatively stable at around 5-5.25%. The rate is plotted below on the y-axis against the year on the x-axis.
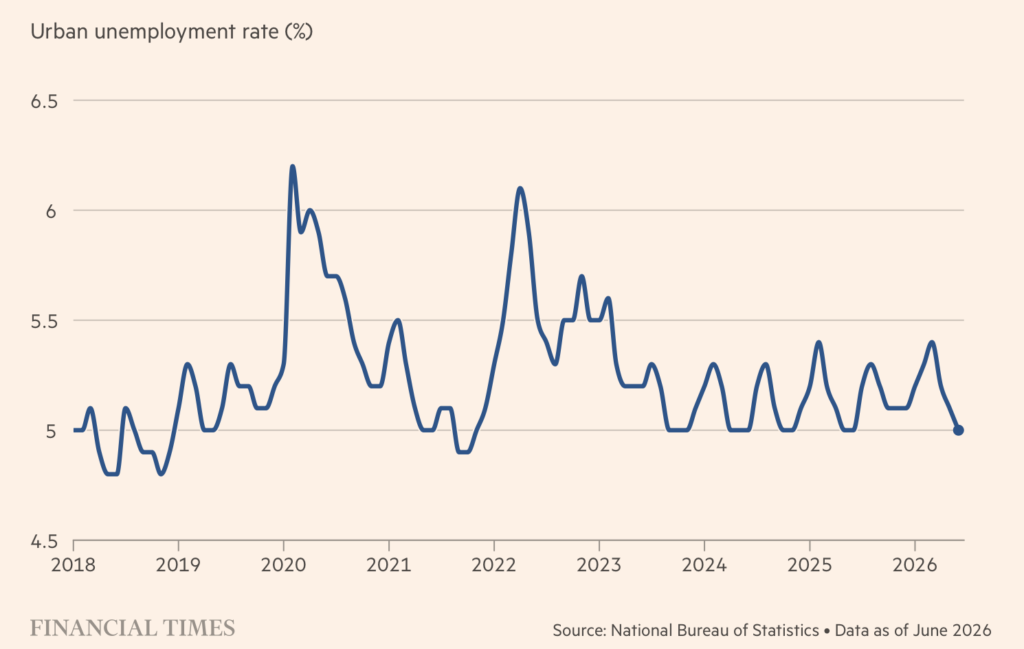 Thomas Hale and William Langley; “China’s great jobs squeeze”; ‘Financial Times’;August 12 2026
But recently the creation of jobs has fallen in the cities. In fact:
“China has declined to set a numerical target for new urban jobs for the next half-decade, the first time it has not done so in decades, amid signs of growing pressures across the world’s second-largest economy.
A five-year plan released by the Ministry of Human Resources and Social Security on Thursday said only that China would “maintain” new urban jobs at “a considerable scale”, without offering a specific number.
The previous six such plans set targets of new urban jobs in the tens of millions for each five-year period. The most recent plan, for 2021-2025, aimed for more than 55mn new jobs.
The omission of the target, a fixture of economic planning since the 1990s, comes amid a sharp slowdown in overall urban employment growth in recent years.
Urban employment was 475mn at the end of last year, according to official data, compared with 473mn at the end of 2024 and 470mn a year earlier.”
Thomas Hale and Joe Leahy; “China drops urban jobs target as economic pressures build”; Financial Times July 10 2026
Graphically, the change in employment in the cities can be seen below. Urban development has been critical to China’s development surge:
“Urbanisation has been a critical engine of China’s growth for decades, as the economy shifted away from agriculture and the factories and construction sites of its booming cities swelled with migrant workers.”
Thomas Hale and Joe Leahy; “China drops urban jobs target as economic pressures build”; Financial Times July 10 2026
“China’s unprecedented economic expansion, from around 1980 until 2020, was underpinned by the migration of hundreds of millions of people from poor rural areas in its interior to work in the factories and construction sites around its cities.”
Thomas Hale and William Langley; “China’s great jobs squeeze”; Financial Times August 12, 2026
In the graph below – the sudden drop in 2021-2022 is of course related to COVID. But also due to a massive construction crisis following a property speculation crash. Hence, the shift of employment from the countryside to the cities underlies these changes:
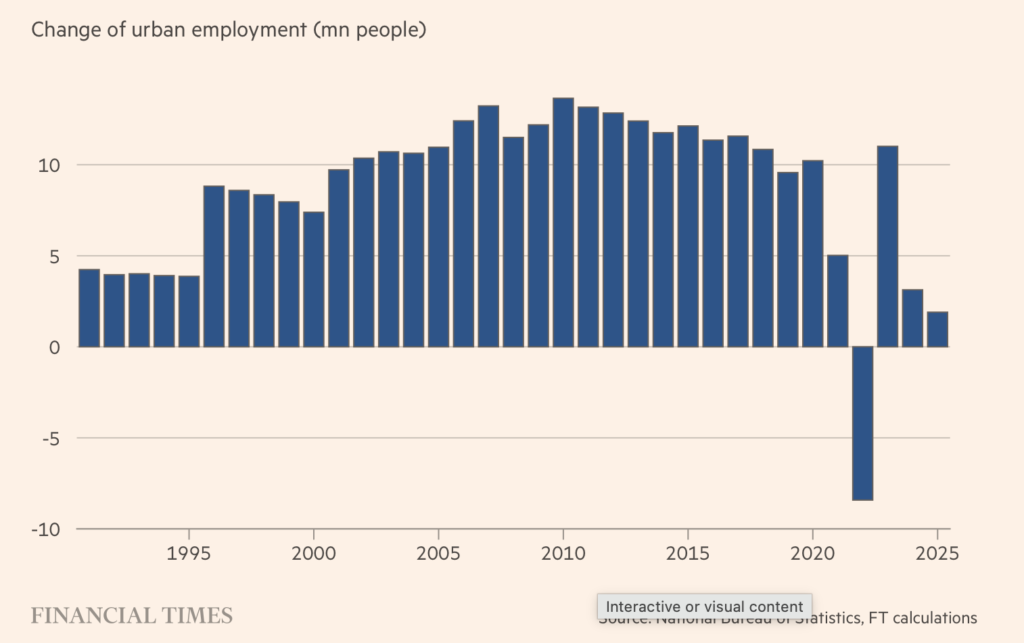
Thomas Hale and Joe Leahy; “China drops urban jobs target as economic pressures build”; Financial Times July 10 2026
Figures show that China has internally, a severe economic decline:
“Economic indicators have in recent months revealed signs of weakness not seen since the Covid-19 pandemic. Retail sales declined in May for the first time since 2022, while fixed-asset investment is now down 4.1 per cent in the first five months year on year.”
Thomas Hale and Joe Leahy; “China drops urban jobs target as economic pressures build”; Financial Times July 10 2026
Hence, despite China’s increasing penetration overseas in its exports, its people are suffering a living decline. This shows up in the indicators of falling retail sales (upper top left graph below); lower investment into property and housing – or ‘fixed-asset investment- (bottom right graph below). Meanwhile, production has also dropped a little (top right graph) – but exports rise (bottom right graph).
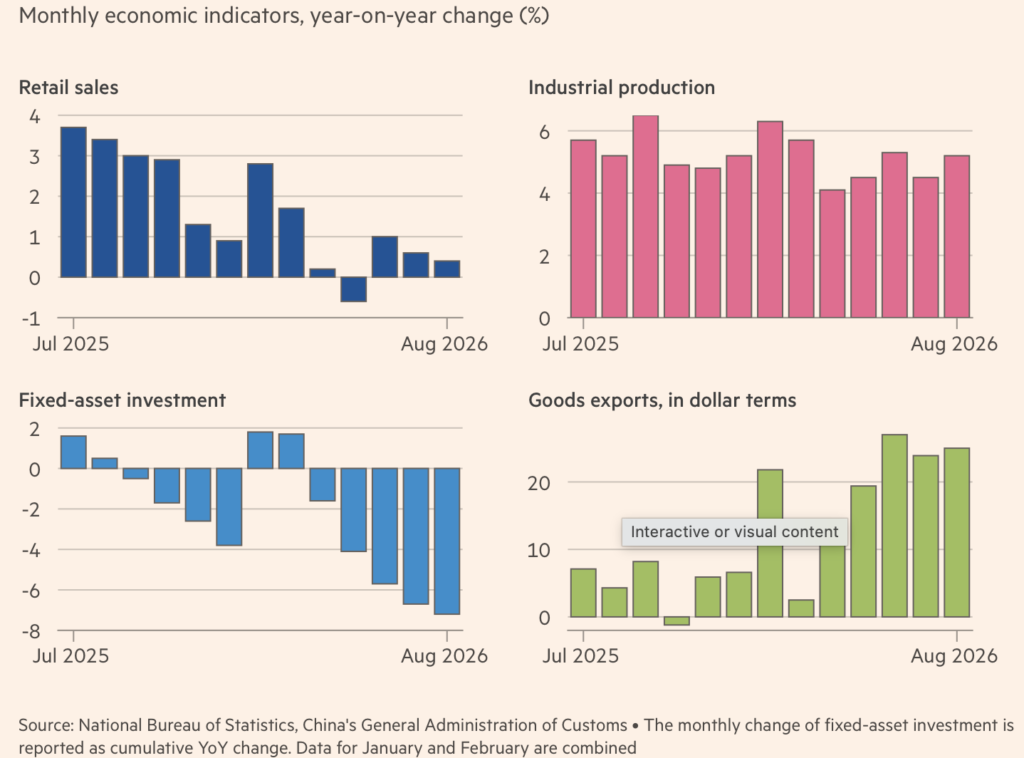 Joe Leahy and Haohsiang Ko”China’s economy shows signs of weakness as investment slumps”: Financial Times September 15, 2026
According to Yuhan Zhang of the Conference Board on China:
“strategic manufacturing remains capable of generating strong output growth, but the domestic demand base needed to absorb that expanding productive capacity remains weak”, said Yuhan Zhang, principal economist at the Conference Board’s China Center.
“The economy is becoming more dependent on productivity gains, technology upgrading and external demand to monetise new industrial capacity.”
Joe Leahy and Haohsiang Ko,”China’s economy shows signs of weakness as investment slumps”: Financial Times, September 15, 2026
In response to the squeeze on household incomes, a shift has occurred back to the countryside. Moreover, a state of alienation that is popularly known as “lie flat” – has taken hold in young people. This is widespread enough to necessitate government active propaganda to target this:
“Some young people are choosing to move back home to live with their parents or to live in cheaper rural areas. There, they take up informal gig work or drop out of the workforce entirely to live on savings…
The Ministry of State Security, the country’s spy agency, this week said foreign forces were seeking to “erode the minds of Chinese youths” by disseminating anti-work propaganda online, encouraging them to drop out or, in Chinese internet parlance, “lie flat”…
Dora Gao (said) “Many of my colleagues and friends around me, probably those aged 28 or 29, have already entered this state — a state of ‘I don’t want to have any career plans or long-term plans anymore, I’m just going to lie flat’,” Gao said. “I want to take a break.”
William Langley; “Chinese spy agency warns nation’s young people against dropping out”; April 30 2026 Financial Times
In lieu of more stable work conditions, the
“While flexible work has served as an economic escape valve, it too now risks becoming overloaded by more people than it can provide jobs for….
flexible employment, an official term that is vaguely defined but implies a broader scope than gig work, has come into greater focus. It stood at 200mn in 2021, according to an official estimate that included part-time work and self-employment as well as “new [forms of] employment… ”.
Thomas Hale and William Langley; “China’s great jobs squeeze”; Financial Times August 12, 2026
The amount of such precarious jobs has dramatically risen as young people find no other stable choice. The graph below – on the left shows the total number sin ‘flex’ jobs. The grpah on the right shows the type of such job in the 3 years 2023, 2024, 2025.
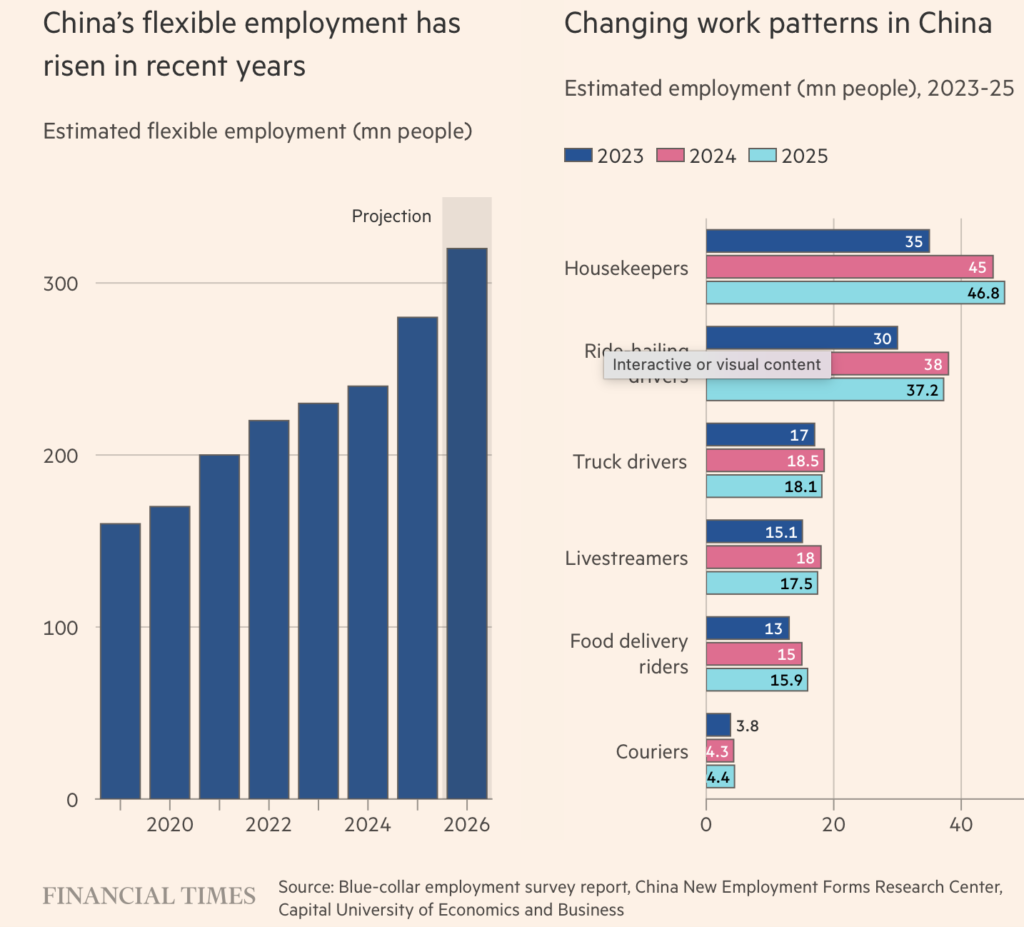 William Langley; “Chinese spy agency warns nation’s young people against dropping out”; April 30 2026 Financial Times
Conclusions
- The inequity world-wide grows between rich and poor – the ruling class and the ruled class of workers and toilers.
- These divisions within Western erst-while democratic nations have become magnified in the last years.
- Despite a lack of full statistics to describe class differences, similar if not identical phenomena are taking place in China.
- Objective reasons to maximise profits of the USA capitalists and the Chinese capitalists are driving to the continuing division of the world. We will discuss in more detail elsewhere the seismic shifts in South America taking place under the fight for supremacy between China and the USA. However, here is only a small indication to add to our prior discussions on this:
“Nicaragua has handed mining concessions covering more than a tenth of its land to Chinese companies in the past three years, expanding Beijing’s foothold in the gold-rich country as it tussles with Washington for influence. The Central American autocracy has awarded 80 concessions that together cover land roughly the size of Northern Ireland to Chinese miners since 2023…
For Nicaraguan dictator Daniel Ortega, the mining concessions are part of projects designed to curry favour with Beijing, which include ports on its Pacific and Atlantic coasts and a major airport redevelopment…
The concessions deepen China’s relationship with its closest partner in the region at a time when the US is expanding its reach into overseas mining and claiming dominance of the Western Hemisphere under the so-called ‘Monroe Doctrine…
While individuals in Ortega’s regime have been under US sanctions since 2017, China says its partnership with Nicaragua has enjoyed “tremendous development” since they re-established bilateral relations in 2021.”
Christine Murray et al: “Gold-rich Nicaragua hands Chinese miners rights to a tenth of its land”; Financial Times 27 September 2026
For MLRG.online 4 October 2026